Meet Your ACT 31 Pennsylvania Continuing Education Requirement Quickly & Affordably.

As sugary sweet as it is crisp and refreshing, soda is a staple in American fridges for good reason. It’s easy to grab on the go, tastes great, and gives you a quick burst of energy. But for all its fizzy charm, overconsumption of soda has some sticky consequences. However, even though we know soda isn’t good for us, there’s no denying that the beverage holds a significant place in diets nationwide.
While many adults are rethinking their soda habits these days, it’s easy to overlook just how much our kids are drinking. Even more interesting is how that number changes depending on where they live.
In this report from PARequirements.com, we’ve cracked open the numbers to show you where kids are reaching for soda most often and what those patterns might reveal about their health.
Click here to download the printable PDF version of the chart.
How Does Soda Affect Your Health?
These days, we’re all aware that soda isn’t the healthiest option, but many may not realize the full extent of its impact. Because soda is made almost entirely of added sugar, which provides calories without providing nutrients, drinking it usually doesn’t make you feel full, even though it contains a lot of calories. This makes it very easy for people to consume far more than what their bodies actually need.
A 12-ounce soda contains between 7 and 10 teaspoons of sugar, amounting to 150 to 200 calories, almost entirely from sugar or high-fructose corn syrup. Even drinking just one can of pop daily for a year could result in a 5-pound weight gain over that period. However, more concerning than just a couple of pounds, high soda consumption is linked to obesity and its related diseases, like type 2 diabetes, heart disease, and liver disease. Carbonated, sugary beverages are also linked to dental disease and tooth decay. Combined with the caffeine in many sodas, there’s also potential for sleep disruption.
Soda and Children’s Health
The traditional wisdom is that excess sugar makes children hyperactive. Although the current research doesn’t back this claim up, there is still reason to believe that excess sugar can impact children’s mental well-being. Signs of excessive sugar consumption in children might not always be obvious at first. Frequent fatigue, mood swings, trouble focusing, and weight gain can all be indicators. High consumption of sugary foods can also cause inflammation in the brain and impact neuron functioning. This inflammation is particularly concerning for children, as it can impair their memory and prevent them from reaching their full potential in school.
And because children’s brains are more malleable than those of adults, their brains can become hardwired to prefer these highly rewarding sugary treats in adulthood, which can make it difficult to adopt healthy diets later in life.
Children are also not immune to the risks of obesity, illness, and dental disease that adults face when over-consuming soda. It’s also possible that children who drink high amounts of soda will neglect more nutritious or beneficial drinks, like water or milk, which can lead to dehydration or a lack of calcium, a vital nutrient for growing kids.
Then there’s the caffeine added to many sodas, which is probably partly responsible for the myth that sugar causes hyperactivity. Children have smaller bodies than adults, meaning they can tolerate less caffeine and are more likely to feel its effects at smaller doses. This can increase incidents of overexcitement, anxiety, and even classroom disruptions in children.
The Data: Which States Drink the Most Soda?
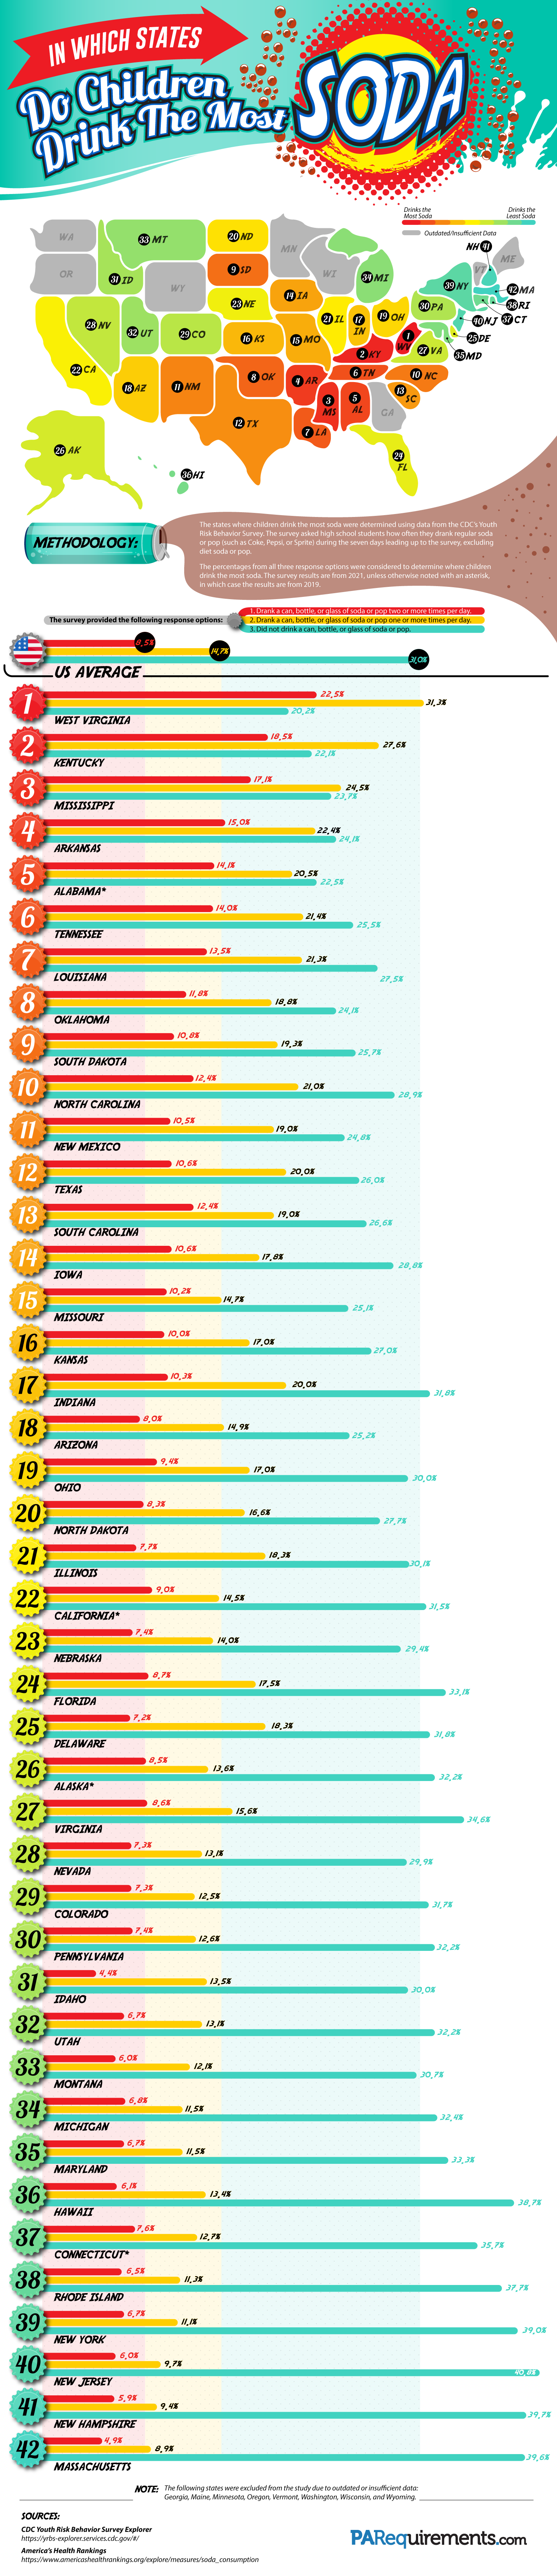
To better understand where American soda consumption is most prevalent, we turned to data from the CDC’s Youth Risk Behavior Survey, which provided data from 42 states (some states were excluded due to insufficient or outdated responses). High school students were asked how often they drank soda over the past week and were given three response options:
- Did not drink a can, bottle, or glass of soda or pop
- Drank a can, bottle, or glass of soda or pop one or more times per day
- Drank a can, bottle, or glass of soda or pop two or more times per day
By weighing all three responses, we were able to rank states by how frequently high schoolers reported drinking soda.
At the very top of the rankings is West Virginia, where a staggering 22.5% of high school students reported drinking soda two or more times a day. Kentucky and Mississippi follow closely behind.
On the flip side, Massachusetts, New Hampshire, and New Jersey reported the lowest levels of frequent soda consumption. In Massachusetts, only 4.9% of high school students reported drinking soda two or more times a day.
Several factors likely contribute to these regional differences. First, many of the states that consume the least soda also have higher-quality education systems. This makes sense, as it appears that education can be as impactful as taxing soda in decreasing the amount we drink. Income plays a role, too. In lower-income areas, soda is often cheaper and more accessible than healthier beverages. Add in limited access to fresh food or nutritional education and it’s easy to see how daily soda can become the norm.
Cultural habits matter as well. In some communities, soda is a staple at meals or social events, while in others, parents and schools actively discourage its consumption. For this reason, it is not surprising that many of the highest-ranking states are in the South.
Drinking the occasional soda isn’t necessarily a problem. However, understanding the trends in soda consumption around the country can help parents, guardians, and teachers initiate more informed conversations, encourage healthier choices, and recognize potential red flags.
The habits we notice (like what’s in a kid’s lunch or what they sip between classes) can open the door to deeper insights about their health and well-being. They might even point to more serious concerns hiding beneath the surface. That’s why PARequirements.com offers mandated reporter training to help professionals recognize the early signs of neglect and other issues. Even seemingly inconsequential details might be what helps someone take action. Explore our training options and get certified today.
High School Soda Consumption by State
| Rank |
State |
Percentage of High School Students Who Drank a Can, Bottle, or Glass of Soda or Pop Two or More Times per Day |
Percentage of High School Students Who Drank a Can, Bottle, or Glass of Soda or Pop One or More Times per Day |
Percentage of High School Students Who Did Not Drink a Can, Bottle, or Glass of Soda or Pop |
| 1 | West Virginia |
22.5% |
31.3% |
20.2% |
| 2 | Kentucky |
18.5% |
27.6% |
22.1% |
| 3 | Mississippi |
17.1% |
24.5% |
23.7% |
| 4 | Arkansas |
15.0% |
22.4% |
24.1% |
| 5 | Alabama* |
14.1% |
20.5% |
22.5% |
| 6 | Tennessee |
14.0% |
21.4% |
25.5% |
| 7 | Louisiana |
13.5% |
21.3% |
27.5% |
| 8 | Oklahoma |
11.8% |
18.8% |
24.1% |
| 9 | South Dakota |
10.8% |
19.3% |
25.7% |
| 10 | North Carolina |
12.4% |
21.0% |
28.9% |
| 11 | New Mexico |
10.5% |
19.0% |
24.8% |
| 12 | Texas |
10.6% |
20.0% |
26.0% |
| 13 | South Carolina |
12.4% |
19.0% |
26.6% |
| 14 | Iowa |
10.6% |
17.8% |
28.8% |
| 15 | Missouri |
10.2% |
14.7% |
25.1% |
| 16 | Kansas |
10.0% |
17.0% |
27.0% |
| 17 | Indiana |
10.3% |
20.0% |
31.8% |
| 18 | Arizona |
8.0% |
14.9% |
25.2% |
| 19 | Ohio |
9.4% |
17.0% |
30.0% |
| 20 | North Dakota |
8.3% |
16.6% |
27.7% |
| 21 | Illinois |
7.7% |
18.3% |
30.1% |
| 22 | California* |
9.0% |
14.5% |
31.5% |
| 23 | Nebraska |
7.4% |
14.0% |
29.4% |
| 24 | Florida |
8.7% |
17.5% |
33.1% |
| 25 | Delaware |
7.2% |
18.3% |
31.8% |
| 26 | Alaska* |
8.5% |
13.6% |
32.2% |
| 27 | Virginia |
8.6% |
15.6% |
34.6% |
| 28 | Nevada |
7.3% |
13.1% |
29.9% |
| 29 | Colorado |
7.3% |
12.5% |
31.7% |
| 30 | Pennsylvania |
7.4% |
12.6% |
32.2% |
| 31 | Idaho |
4.4% |
13.5% |
30.0% |
| 32 | Utah |
6.7% |
13.1% |
32.2% |
| 33 | Montana |
6.0% |
12.1% |
30.7% |
| 34 | Michigan |
6.8% |
11.5% |
32.4% |
| 35 | Maryland |
6.7% |
11.5% |
33.3% |
| 36 | Hawaii |
6.1% |
13.4% |
38.7% |
| 37 | Connecticut* |
7.6% |
12.7% |
35.7% |
| 38 | Rhode Island |
6.5% |
11.3% |
37.7% |
| 39 | New York |
6.7% |
11.1% |
39.0% |
| 40 | New Jersey |
6.0% |
9.7% |
40.8% |
| 41 | New Hampshire |
5.9% |
9.4% |
39.7% |
| 42 | Massachusetts |
4.9% |
8.9% |
39.6% |
| US Average |
8.5% |
14.7% |
31.0% |
Methodology:
The states where children drink the most soda were determined using data from the CDC’s Youth Risk Behavior Survey. The survey asked high school students how often they drank regular soda or pop (such as Coke, Pepsi, or Sprite) during the seven days leading up to the survey, excluding diet soda or pop.
The survey provided the following response options:
- I did not drink soda or pop during the past 7 days
- 1 to 3 times during the past 7 days
- 4 to 6 times during the past 7 days
- 1 time per day
- 2 times per day
- 3 times per day
- 4 or more times per day
However, the CDC only provides data in these three categories:
- Did not drink a can, bottle, or glass of soda or pop (in the past 7 days)
- Drank a can, bottle, or glass of soda or pop one or more times per day (in the past 7 days)
- Drank a can, bottle, or glass of soda or pop two or more times per day (in the past 7 days)
The percentages from all three data categories were considered to determine where children drink the most soda. The survey results are from 2021, unless otherwise noted with an asterisk, in which case the results are from 2019. At the time of the research and analysis in June 2025, this was the most recent complete dataset available from the CDC. The CDC’s newest available data for 2023 was incomplete and limited (including only 6 states), and was therefore determined to be unreliable.
Sources
CDC Youth Risk Behavior Survey Explorer https://yrbs-explorer.services.cdc.gov/#/
America’s Health Rankings https://www.americashealthrankings.org/explore/measures/soda_consumption