Meet Your ACT 31 Pennsylvania Continuing Education Requirement Quickly & Affordably.

Click the image to view the full size visualization
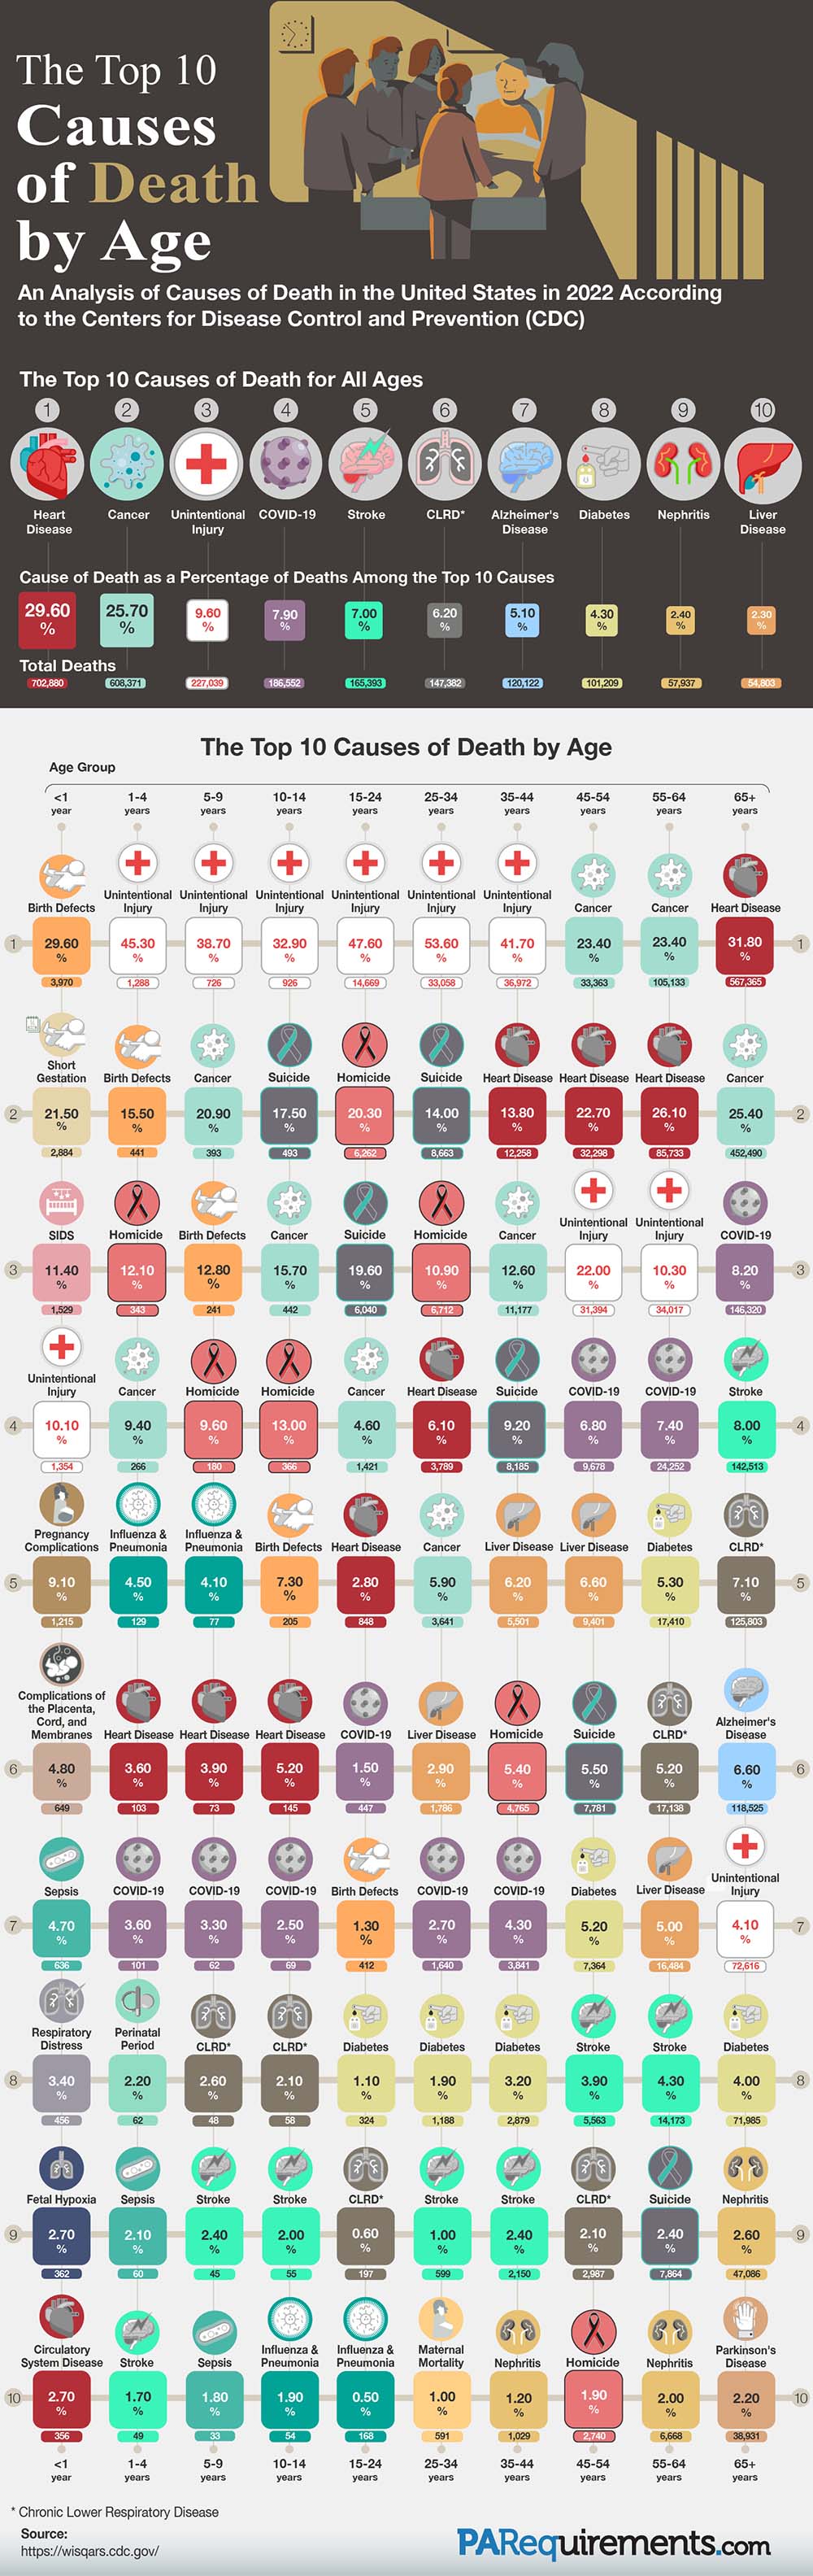
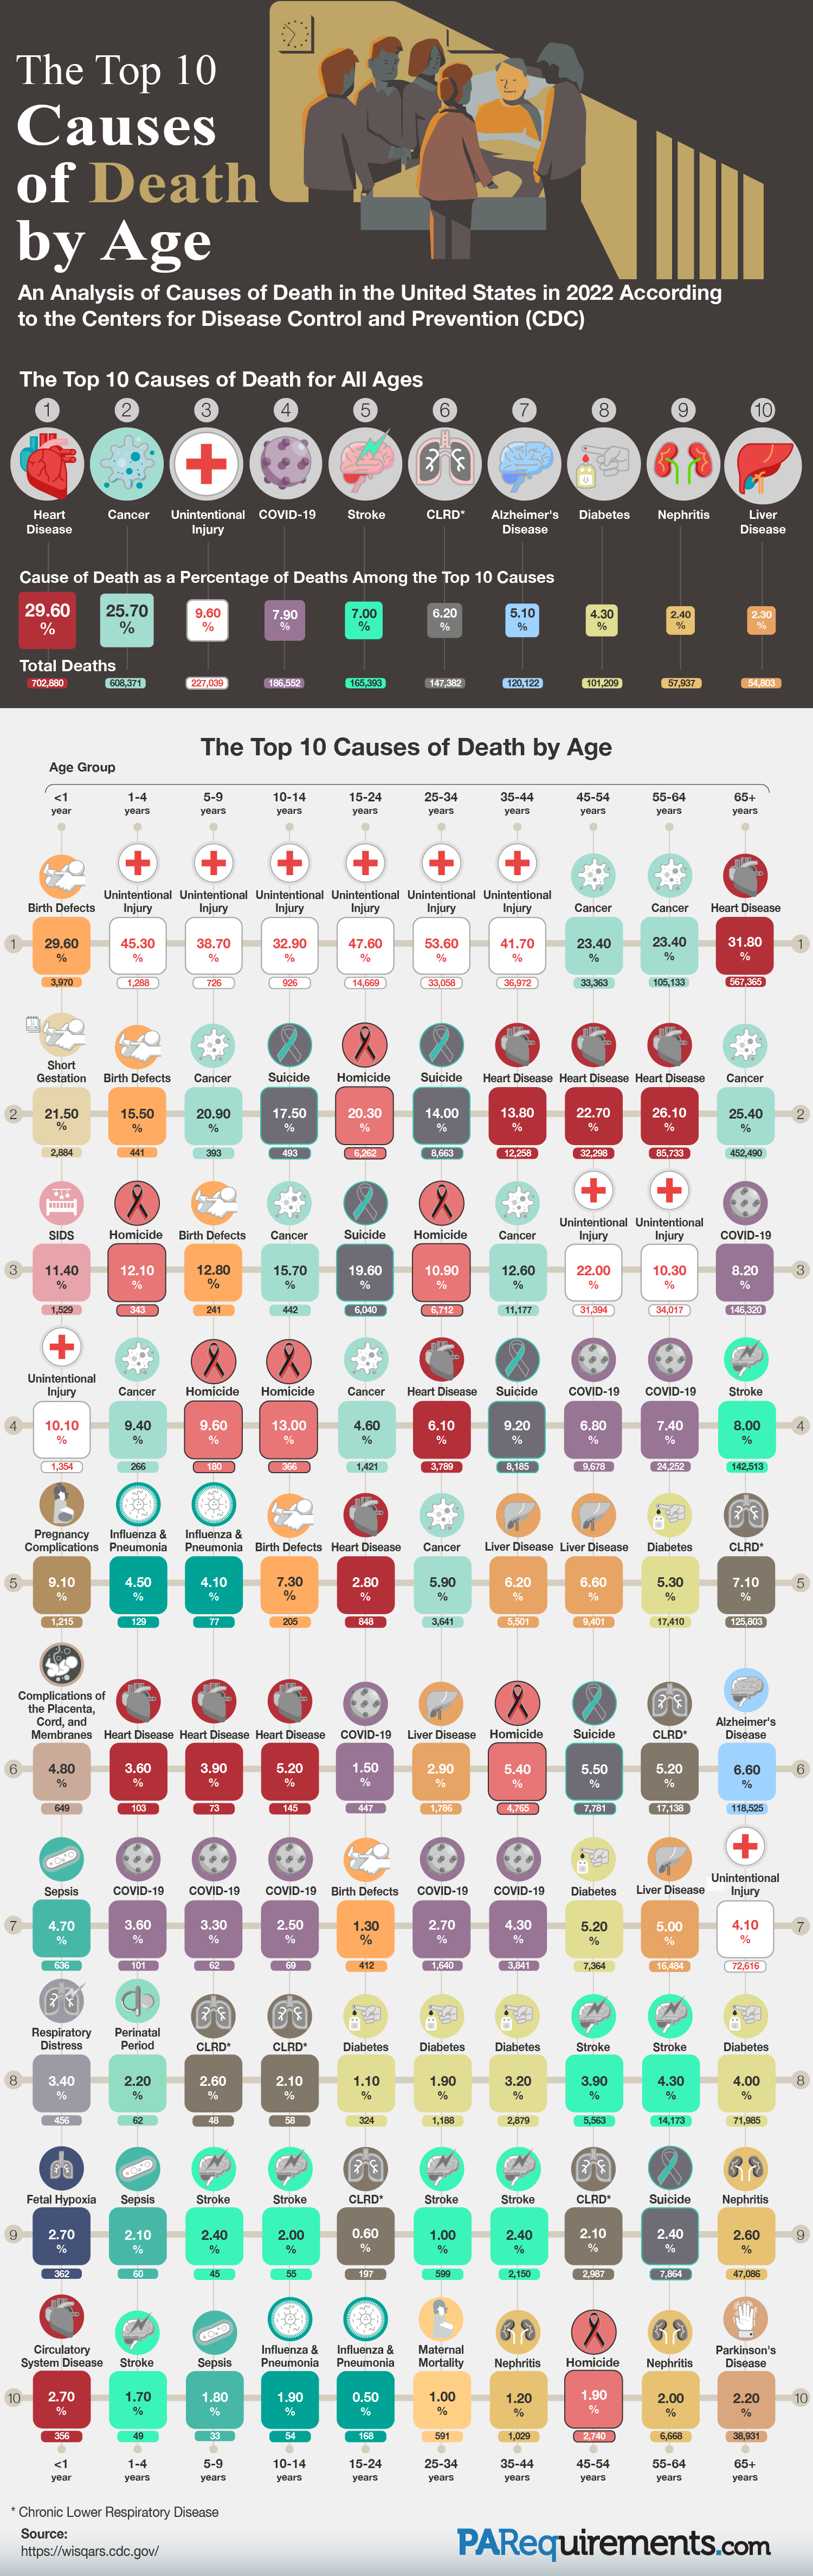
The topic of death is often uncomfortable, but understanding its primary causes can help prevent avoidable fatalities. The leading causes of death differ depending on the stage of life, from infancy to older adulthood, and are influenced by genetics, lifestyle factors, mental health, and environmental conditions. PARequirements has reviewed the top 10 causes of death among various age groups in the United States, using current statistics to identify significant risks and recommend prevention strategies.
Click here to download the printable PDF version of the chart.
The Primary Causes of Mortality in the United States
Heart disease, cancer, and unintentional injuries are the top three leading causes of death in the United States. Heart disease impacts both young and older individuals and is often linked to chronic lifestyle conditions. Cancer, prevalent in adults, is influenced by genetic and environmental factors, with 2,001,140 new cases projected in 2024, translating to about 5,480 daily diagnoses. Unintentional injuries, such as car accidents and falls, are a leading cause of death for younger people, highlighting the importance of education and awareness. Other significant causes include stroke, diabetes, and chronic respiratory diseases like COVID-19, which, despite declining fatalities, remain among the top causes across all age groups.
The Top 10 Causes of Death for People of All Ages
| Rank | Cause of Death | Cause of Death as a Percentage of Deaths Among the Top 10 Causes | Total Deaths (2022) |
| 1 | Heart Disease | 29.6% | 702,880 |
| 2 | Cancer | 25.7% | 608,371 |
| 3 | Unintentional Injury | 9.6% | 227,039 |
| 4 | COVID-19 | 7.9% | 186,552 |
| 5 | Stroke | 7.0% | 165,393 |
| 6 | Chronic Lower Respiratory Disease | 6.2% | 147,382 |
| 7 | Alzheimer's Disease | 5.1% | 120,122 |
| 8 | Diabetes | 4.3% | 101,209 |
| 9 | Nephritis | 2.4% | 57,937 |
| 10 | Liver Disease | 2.3% | 54,803 |
The Leading Causes of Death for Infants in America
The top causes of infant deaths are predominantly perinatal and congenital conditions. Birth defects account for nearly 30% of fatalities, followed by prematurity, short gestation, and low birth weight. Sudden Infant Death Syndrome (SIDS) and unintentional injuries are also significant concerns.
Strategies for preventing infant deaths include:
- Providing comprehensive prenatal care, including genetic screening and maternal health monitoring.
- Ensuring high-quality neonatal care for preterm and low-birth-weight infants.
- Practicing safe sleep habits by placing infants on their backs, using firm mattresses, and avoiding soft bedding.
- Learning proper car seat usage, safe feeding practices, and home safety measures.
Child Abuse and the Main Causes of Death in Early Childhood
As infants develop into toddlers, the primary causes of mortality move from neonatal conditions to external factors. Due to their natural curiosity, they are at increased risk. Unintentional injuries—such as drowning, poisoning, and falls—account for nearly half of all deaths in children aged 1 to 4. Other risks include birth defects, cancer, and pneumonia.
One of the most concerning statistics from this analysis is that homicide is among the top 10 causes of death for children aged one and older. In 2022, there were alarmingly 5.39 child deaths per day due to child abuse and neglect. This highly preventable cause of death has reached epidemic levels in the United States.
Mandated reporters—such as teachers, social workers, doctors, and nurses—play a crucial role in protecting these children, as they are required to report any suspected cases of abuse and neglect. If you are a healthcare professional, consider taking our mandated reporter training courses available for initial licensure and license renewal.
For parents, it is essential to discuss safety and boundaries with children to help them recognize instances of abuse and feel comfortable reporting them. Additionally, selecting a trustworthy babysitter is a crucial first step in keeping children safe.
Strategies to prevent toddler deaths:
- Carefully evaluate babysitters and other caretakers to ensure child safety and well-being.
- Educate caregivers on reducing the risks of unintentional injuries, including childproofing homes and supervising children near water.
- Utilize advancements in pediatric oncology for improved cancer detection and treatment.
- Ensure timely vaccination and treatment for illnesses like pneumonia.
The Primary Causes of Death for Middle Childhood and Preteens
In children aged 5 to 9, unintentional injuries remain the leading cause of death, although they occur less frequently than in toddlers. Cancer becomes more prominent in this age group, accounting for over 20% of deaths, followed by congenital conditions and homicide. Respiratory illnesses such as influenza and pneumonia also contribute to mortality in middle childhood.
As children transition into preteens and young teens, the causes of death begin to shift. Unintentional injuries still top the list for 10 to 14-year-olds in the United States, but suicide becomes a significant concern during this stage of development. Although cancer remains a leading cause, its prevalence decreases slightly compared to younger children. Disturbingly, the incidence of homicide increases from 9.6% to 13% in preteens and early teens.
Addressing mental health issues in young people is crucial, especially given the rising concern about suicide. This preventable cause of death now accounts for nearly 18% of the top ten causes among adolescents, underscoring the urgent need for proactive measures to identify and support at-risk youth. Recognizing the signs that someone may be suicidal and providing crisis support is essential to prevention.
Proactive tactics to minimize deaths:
- Provide safety education that includes road safety and the use of safety gear to minimize accidental deaths.
- Continue early cancer detection and ensure that those affected access specialized care.
- Encourage routine health checkups, good hygiene practices like handwashing, and prompt treatment to reduce severe respiratory illnesses.
- Offer mental health resources to support adolescents, including counseling services, hotlines, and crisis intervention programs.
The Main Causes of Mortality in Teenagers and Young Adults
Unintentional injuries, mainly resulting from automobile accidents and substance use, account for nearly half of all deaths in teenagers and young adults. In 2022, 811 teen drivers aged 15–18 lost their lives in vehicular crashes, with 22% of these cases involving alcohol consumption. Additionally, teenagers and young drivers face a higher risk of crashes due to distractions, particularly cell phone use.
Homicide and suicide rates among young people have also risen significantly, with recent data showing that suicide alone accounted for 19.6% of deaths among individuals aged 15–24. This statistic points to a severe mental health crisis that must be addressed. Encouraging young people to express their feelings to trusted individuals or through therapy may help tackle these core issues and lead to effective solutions. Educating teens and young adults about emotional regulation and mindfulness practices can help prevent problems from escalating, ultimately reducing mortality rates.
Prevention methods:
- Provide education about the dangers of impaired or hazardous driving and the impacts of substance use.
- Offer mental health support resources and suicide prevention programs specifically designed for teens and young adults.
- Teach skills for regulating emotions and resolving conflicts to help prevent both suicide and homicide.
- Emphasize conflict resolution skills that encourage dialogue and negotiation, aiming to reduce violence and improve understanding among conflicting individuals.
The Leading Causes of Deaths in Adults in the U.S.
For the 25 to 44 age bracket, unintentional injuries remain the leading cause of death, mainly driven by opioid overdoses and car accidents. Suicide, homicide, and heart disease are also significant, with cancer and liver disease gaining prominence.
For individuals aged 45 to 54, chronic diseases such as cancer and heart disease surpass unintentional injuries as the leading causes of death. Additionally, liver disease, diabetes, and stroke are major contributors to mortality in this age group.
For adults aged 55 to 64, chronic diseases continue to dominate the mortality statistics, with cancer and heart disease accounting for over half of all deaths. Diabetes, respiratory diseases, and liver disease also play significant roles.
Prevention strategies:
- Combat the opioid epidemic through treatment programs and harm reduction methods, such as naloxone distribution and fentanyl test kit usage.
- Practice healthy lifestyles that include regular exercise and a balanced diet.
- Maintain regular health screenings to detect and manage chronic conditions early.
- Stay updated on vaccination programs, including influenza and COVID-19, to prevent serious illness.
The Primary Causes of Death in U.S. Seniors
In American seniors aged 65 and older, heart disease and cancer are the leading causes of death, together accounting for more than half of all fatalities. Other significant contributors include stroke, chronic lower respiratory diseases, and Alzheimer’s disease. While unintentional injuries are less common than in younger age groups, they remain a concern, mainly due to falls.
Ways to minimize the leading causes of death in Seniors:
- Eliminate smoking to minimize the risks of cancer, respiratory diseases, and stroke.
- Manage chronic conditions by adhering to medication regimens and attending regular checkups.
- Promote cognitive health through mental stimulation and social engagement to help delay the onset of Alzheimer’s disease.
- Implement fall prevention strategies, such as strength training and making modifications at home.
Deaths: The Most Common Causes by Age Group
Each stage of life presents unique risks, but targeted prevention efforts—from prenatal care and childproofing homes to addressing chronic diseases and mental health—can significantly reduce mortality rates. By addressing the root causes of death and focusing on these tailored prevention strategies, we can improve outcomes and enhance the quality of life for individuals at every stage of their lives.
The Top 10 Causes of Death for Children Who Are Less Than One Year Old
| Rank | Cause of Death | Cause of Death as a Percentage of Deaths Among the Top 10 Causes | Total Deaths (2022) |
| 1 | Birth Defects | 29.6% | 3,970 |
| 2 | Short Gestation | 21.5% | 2,884 |
| 3 | SIDS | 11.4% | 1,529 |
| 4 | Unintentional Injury | 10.1% | 1,354 |
| 5 | Pregnancy Complications | 9.1%
9.1%
|
1,215 |
| 6 | Complications of the Placenta, Cord, and Membranes |
4.8% | 649 |
| 7 | Sepsis | 4.7%
4.7%
|
636 |
| 8 | Respiratory Distress | 3.4% | 456 |
| 9 | Fetal Hypoxia | 2.7%
2.7%
|
362 |
| 10 | Circulatory System Disease | 2.7% | 356 |
The Top 10 Causes of Death for Children Aged 1–4
| Rank | Cause of Death | Cause of Death as a Percentage of Deaths Among the Top 10 Causes | Total Deaths (2022) |
| 1 | Unintentional Injury | 45.3%
45.3%
|
1,288 |
| 2 | Birth Defects | 15.5% | 441 |
| 3 | Homicide | 12.1% | 343 |
| 4 | Cancer | 9.4% | 266 |
| 5 | Influenza & Pneumonia
Influenza & Pneumonia
|
9.1%
4.5%
|
129 |
| 6 | Heart Disease | 3.6% | 103 |
| 7 | COVID-19 | 4.7%
3.6%
|
101 |
| 8 | Perinatal Period | 2.2% | 62 |
| 9 | Sepsis
Sepsis
|
2.7%
2.1%
|
60 |
| 10 | Stroke | 1.7% | 49 |
The Top 10 Causes of Death for Children Aged 5–9
| Rank | Cause of Death | Cause of Death as a Percentage of Deaths Among the Top 10 Causes | Total Deaths (2022) |
| 1 | Unintentional Injury | 45.3%
38.7%
|
726 |
| 2 | Cancer | 20.9% | 393 |
| 3 | Birth Defects | 12.8% | 241 |
| 4 | Homicide | 9.6% | 180 |
| 5 | Influenza & Pneumonia
Influenza & Pneumonia
|
9.1%
4.1%
|
77 |
| 6 | Heart Disease | 3.9% | 73 |
| 7 | COVID-19 | 4.7%
3.3%
|
62 |
| 8 | Chronic Lower Respiratory Disease | 2.6% | 48 |
| 9 | Sepsis
Stroke
|
2.7%
2.4%
|
45 |
| 10 | Sepsis | 1.8% | 33 |
The Top 10 Causes of Death for Children Aged 10–14
| Rank | Cause of Death | Cause of Death as a Percentage of Deaths Among the Top 10 Causes | Total Deaths (2022) |
| 1 | Unintentional Injury | 45.3%
32.9%
|
926 |
| 2 | Suicide | 17.5% | 493 |
| 3 | Cancer | 15.7% | 442 |
| 4 | Homicide | 13.0% | 366 |
| 5 | Influenza & Pneumonia
Birth Defects
|
9.1%
7.3%
|
205 |
| 6 | Heart Disease | 5.2% | 145 |
| 7 | COVID-19 | 4.7%
2.5%
|
69 |
| 8 | Chronic Lower Respiratory Disease | 2.1% | 58 |
| 9 | Sepsis
Stroke
|
2.7%
2.0%
|
55 |
| 10 | Influenza & Pneumonia | 1.8% | 54 |
The Top 10 Causes of Death for People Aged 15–24
| Rank | Cause of Death | Cause of Death as a Percentage of Deaths Among the Top 10 Causes | Total Deaths (2022) |
| 1 | Unintentional Injury | 45.3%
47.6%
|
14,669 |
| 2 | Homicide | 20.3% | 6,262 |
| 3 | Suicide | 19.6% | 6,040 |
| 4 | Cancer | 4.6% | 1,421 |
| 5 | Influenza & Pneumonia
Heart Disease
|
9.1%
2.8%
|
848 |
| 6 | COVID-19 | 1.5% | 447 |
| 7 | Birth Defects | 4.7%
1.3%
|
412 |
| 8 | Diabetes | 1.1% | 324 |
| 9 | Sepsis
Chronic Lower Respiratory Disease
|
2.7%
0.6%
|
197 |
| 10 | Influenza & Pneumonia | 0.5% | 168 |
The Top 10 Causes of Death for People Aged 25–34
| Rank | Cause of Death | Cause of Death as a Percentage of Deaths Among the Top 10 Causes | Total Deaths (2022) |
| 1 | Unintentional Injury | 45.3%
53.6%
53.6%
|
33,058 |
| 2 | Suicide | 14.0% | 8,663 |
| 3 | Homicide | 10.9% | 6,712 |
| 4 | Heart Disease | 6.1% | 3,789 |
| 5 | Influenza & Pneumonia
Cancer
|
9.1%
5.9%
|
3,641 |
| 6 | Liver | 2.9% | 1,786 |
| 7 | Birth Defects | 4.7%
2.7%
|
1,640 |
| 8 | Diabetes | 1.9% | 1,188 |
| 9 | Sepsis
Stroke
|
2.7%
1.0%
|
599 |
| 10 | Maternal Mortality | 1.0% | 591 |
The Top 10 Causes of Death for People Aged 35–44
| Rank | Cause of Death | Cause of Death as a Percentage of Deaths Among the Top 10 Causes | Total Deaths (2022) |
| 1 | Unintentional Injury | 45.3%
53.6%
41.7%
|
3,6972 |
| 2 | Heart Disease | 13.8% | 11,177 |
| 3 | Cancer | 12.6% | 8,185 |
| 4 | Suicide | 9.2% | 5,501 |
| 5 | Influenza & Pneumonia
Liver Disease
|
9.1%
6.2%
|
4,765 |
| 6 | Homicide | 5.4% | 3,841 |
| 7 | COVID-19 | 4.7%
4.3%
|
2,879 |
| 8 | Diabetes | 3.2% | 1,188 |
| 9 | Sepsis
Stroke
|
2.7%
2.4%
|
2,150 |
| 10 | Nephritis | 1.2% | 1,029 |
The Top 10 Causes of Death for People Aged 45–54
| Rank | Cause of Death | Cause of Death as a Percentage of Deaths Among the Top 10 Causes | Total Deaths (2022) |
| 1 | Cancer | 45.3%
53.6%
23.4%
|
33,363 |
| 2 | Heart Disease | 22.7% | 32,298 |
| 3 | Unintentional Injury | 22.0% | 31,394 |
| 4 | COVID-19 | 6.8% | 9,678 |
| 5 | Influenza & Pneumonia
Liver Disease
|
9.1%
6.6%
|
9,401 |
| 6 | Suicide | 5.5% | 7,781 |
| 7 | Diabetes | 4.7%
5.2%
|
7,364 |
| 8 | Stroke | 3.9% | 5,563 |
| 9 | Sepsis
Chronic Lower Respiratory Disease
|
2.7%
2.1%
|
2,987 |
| 10 | Homicide | 1.9% | 2,740 |
The Top 10 Causes of Death for People Aged 55–64
| Rank | Cause of Death | Cause of Death as a Percentage of Deaths Among the Top 10 Causes | Total Deaths (2022) |
| 1 | Cancer | 45.3%
53.6%
32.0%
|
105,133 |
| 2 | Heart Disease | 26.1% | 85,733 |
| 3 | Unintentional Injury | 10.3% | 34,017 |
| 4 | COVID-19 | 7.4% | 24,252 |
| 5 | Influenza & Pneumonia
Diabetes
|
9.1%
5.3%
|
17,410 |
| 6 | Chronic Lower Respiratory Disease |
5.2% | 17,138 |
| 7 | Liver Disease | 4.7%
5.0%
|
16,484 |
| 8 | Stroke | 4.3% | 14,173 |
| 9 | Sepsis
Suicide
|
2.7%
2.4%
|
7,864 |
| 10 | Nephritis | 2.0% | 6,668 |
The Top 10 Causes of Death for People Aged 65 and Older
| Rank | Cause of Death | Cause of Death as a Percentage of Deaths Among the Top 10 Causes | Total Deaths (2022) |
| 1 | Heart Disease | 45.3%
53.6%
31.8%
|
567,365 |
| 2 | Cancer | 25.4% | 452,490 |
| 3 | COVID-19 | 8.2% | 146,320 |
| 4 | Stroke | 8.0% | 142,513 |
| 5 | Influenza & Pneumonia
Chronic Lower Respiratory
Disease |
9.1%
7.1%
|
125,803 |
| 6 | Alzheimer's Disease | 6.6% | 118,525 |
| 7 | Unintentional Injury | 4.7%
4.1%
|
72,616 |
| 8 | Diabetes | 4.0% | 71,985 |
| 9 | Sepsis
Nephritis
|
2.7%
2.6%
|
47,086 |
| 10 | Parkinson's Disease | 2.2% | 38,931 |