Meet Your ACT 31 Pennsylvania Continuing Education Requirement Quickly & Affordably.

Bullying is a widespread problem affecting millions of children across the United States, with more than one-third of children aged 6 to 17 having experienced it at least once in the past year. From school bullying to cyberbullying, the issue has only grown in recent years.
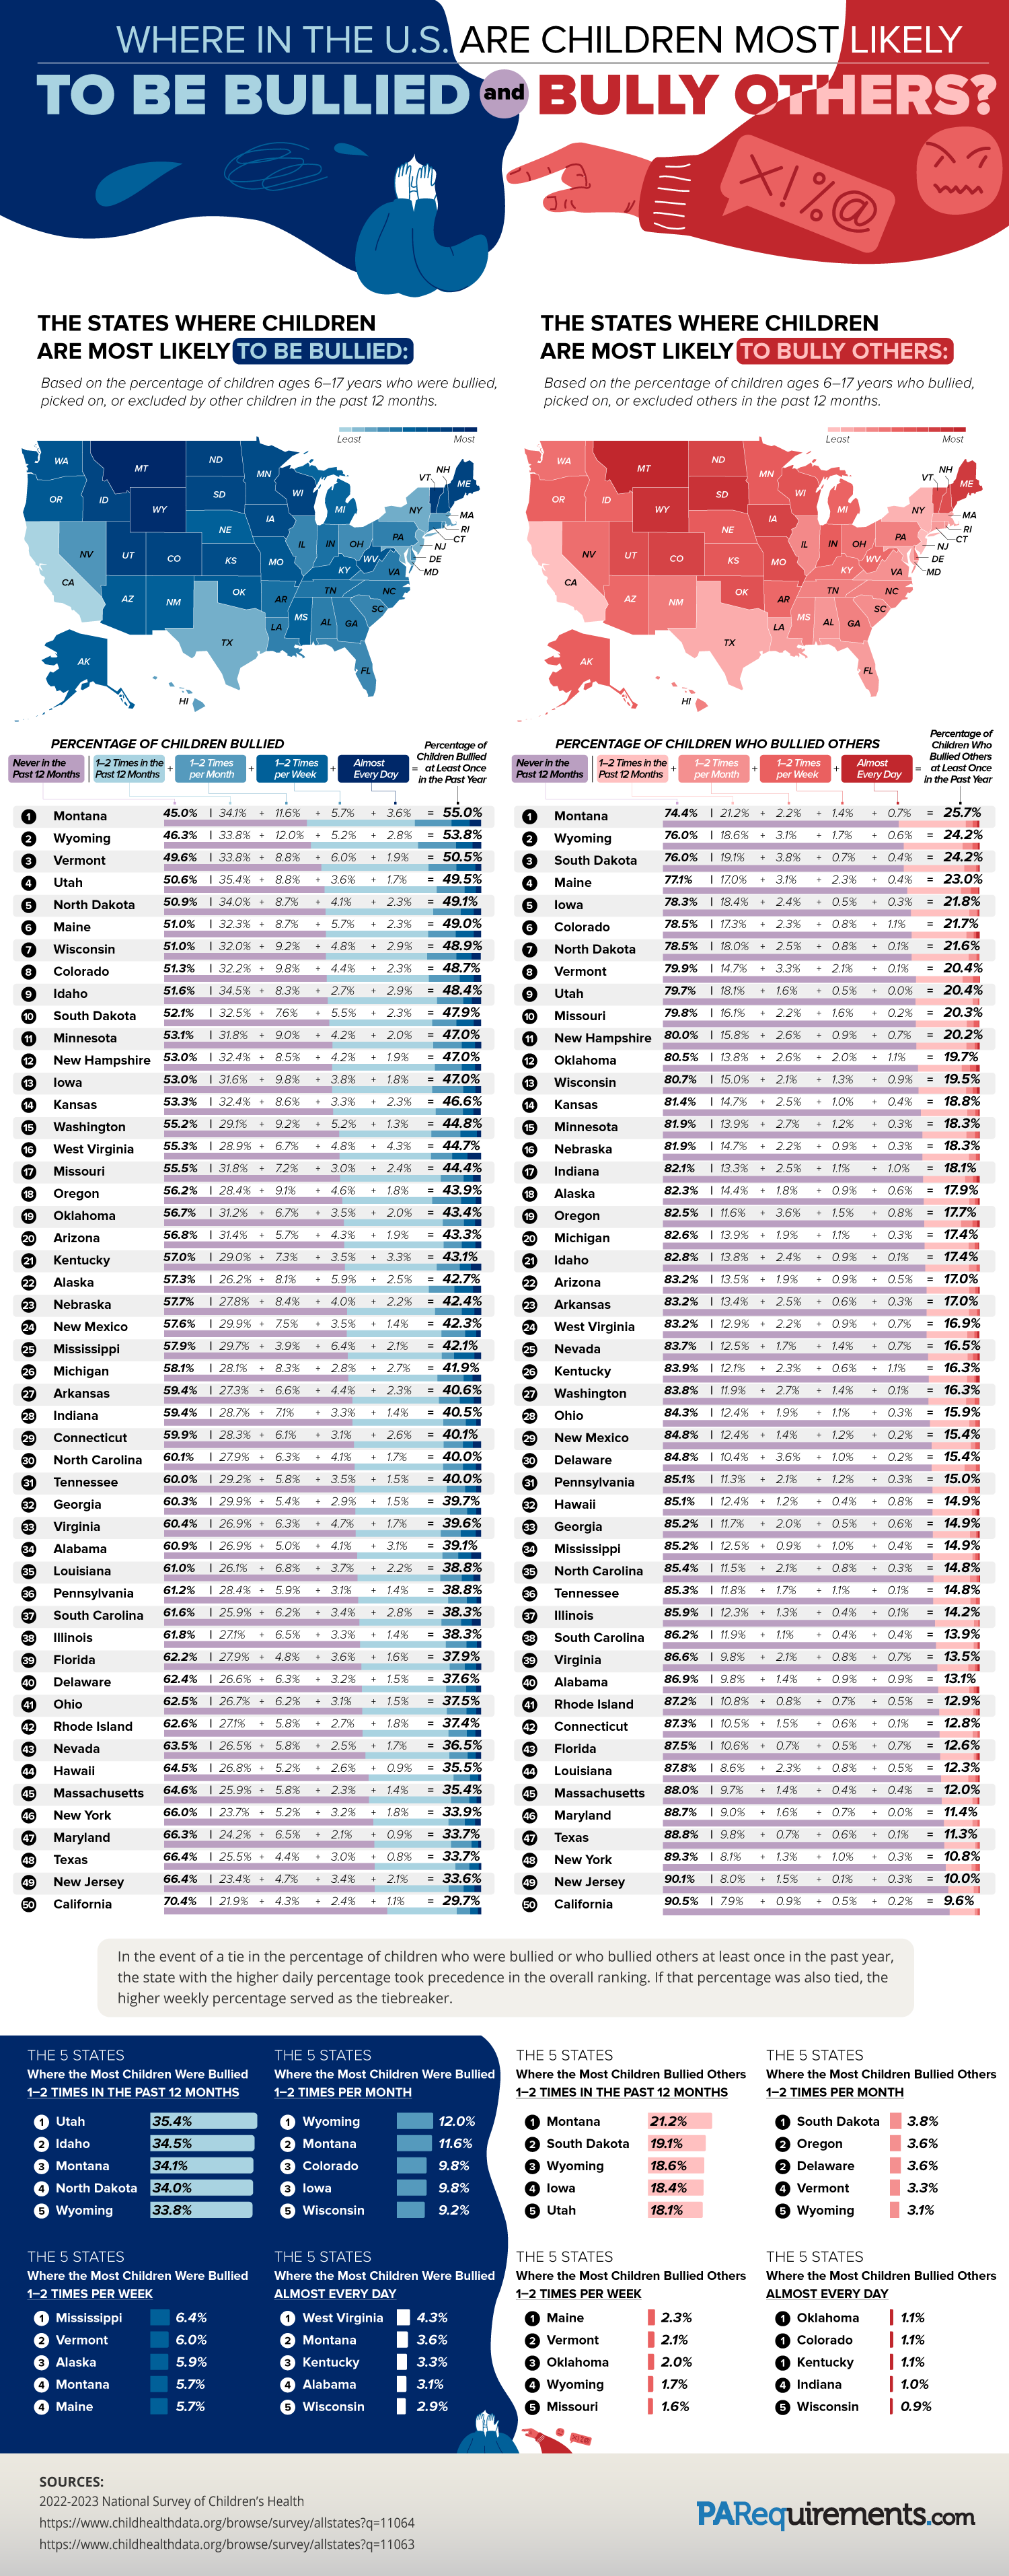
A survey conducted by The Child & Adolescent Health Measurement Initiative shows that bullying is much more prevalent in certain states than others. Using data from their 2022–2023 National Survey of Children’s Health, the team at PARequirements.com created a graphic highlighting the U.S. states with the highest rates of children who are bullied and those with the highest rates of children who bully others.
The National Survey of Children’s Health provides data on the percentage of children aged 6–17 who have either experienced bullying — meaning they were “bullied, picked on, or excluded by other children in the past 12 months” — or who have bullied others in the same way. This data gives an eye-opening look at how often children in the U.S. face peer bullying. Explore the graphic below to see which states have the most serious bullying problems.
Where in the U.S. Are Children Most Likely to Be Bullied?
The state where children are most likely to experience bullying is Montana. In the past year, 55% of children aged 6–17 were bullied at least once. Of this percentage, 11.6% were bullied 1–2 times per month, 5.7% were bullied 1–2 times per week, and sadly, 3.6% of children in Montana were bullied almost every day. Montana has the second-highest rate of children who are bullied almost daily, following West Virginia’s 4.3%. Wyoming was a close second to Montana overall, with 53.8% of children having been bullied at least once in the past year.
The 10 States With the Highest Percentage of Children Bullied at Least Once in the Past Year
- Montana: 55.0%
- Wyoming: 53.8%
- Vermont: 50.5%
- Utah: 49.5%
- North Dakota: 49.1%
- Maine: 49.0%
- Wisconsin: 48.9%
- Colorado: 48.7%
- Idaho: 48.4%
- South Dakota: 47.9%
Where in the U.S. Are Children Most Likely to Bully Others?
The state where children are most likely to bully others is also Montana. Just over a quarter of children aged 6–17 in Montana have bullied, picked on, or excluded others at least once in the past year. Among these, 2.2% have bullied others 1–2 times per month, 1.4% have bullied others 1–2 times per week, and 0.7% of children in Montana have bullied others almost daily. Once again, Wyoming ranks just below Montana with the second-highest rate of bullying, with 24.2% of children having bullied or picked on others at least once in the past year.
The 10 States With the Highest Percentage of Children Who Bullied Others at Least Once in the Past Year
- Montana: 25.7%
- Wyoming: 24.2%
- South Dakota: 24.2%
- Maine: 23.0%
- Iowa: 21.8%
- Colorado: 21.7%
- North Dakota: 21.6%
- Vermont: 20.4%
- Utah: 20.4%
- Missouri: 20.3%
What Are the Different Types of Bullying?
Bullying is an aggressive behavior that can include teasing, picking on, or excluding another child. It can take many forms and extend beyond school bullying. With the rise of the Internet, electronic bullying has become one of the most common types. What are the other forms of bullying? The four most common types of bullying include:
- Physical bullying involves physically touching or harming another person and can include kicking, punching, hitting, biting, and threatening violence.
- Verbal bullying occurs when someone makes fun of another person, calls them names, or persistently teases them.
- Cyberbullying is a type of electronic bullying that occurs through digital devices like messaging apps, social media, online forums, and other internet outlets.
- Social or relational bullying is a type of bullying that often happens behind someone’s back, to damage their social reputation. Spreading rumors is a common form of social bullying.
How to Prevent Bullying?
Bullying can be prevented, but it requires parents, educators, and other adults in children’s lives to set a good example and create a safe space for them. Several strategies can be taken to prevent bullying in the classroom and at home.
- Teach children to recognize bullying and understand that it is wrong.
- Give them tips for standing up to a bully, like confidently saying “no,” “stop,” or simply walking away.
- Encourage them to talk to an adult if they need help dealing with a bully.
- Help children build confidence by encouraging them to be themselves and pursue their interests.
- Be a good role model by showing children how to treat others with kindness and respect.
“Bullying is a learned behavior. It’s up to us to teach our children how to be kind and respectful to others.” — Caroline Kennedy.
Although there is no foolproof way to prevent bullying completely, these strategies can help create a safer environment at school and home for all children.
Are you a social worker, daycare worker, counselor, or school official in Pennsylvania looking to learn how to recognize the signs of bullying and how to prevent it? Our mandated reporter training for child abuse can help you identify the signs of bullying and share different methods you can use to reduce the number of bullying incidents. Together, we can prevent bullying and provide children with a safe space to learn, grow, and have fun.
The States Where Children Are Most Likely to Be Bullied
Based on the percentage of children ages 6–17 years who were bullied, picked on, or excluded by other children in the past 12 months.?
| Rank | State | Percentage of Children Never Bullied in the Past 12 Months | Percentage of Children Bullied 1–2 Times in the Past 12 Months | Percentage of Children Bullied 1–2 Times per Month | Percentage of Children Bullied 1–2 Times per Week | Percentage of Children Bullied Almost Every Day | Percentage of Children Bullied at Least Once in the Past Year |
| 1 | Montana | 45.0% | 34.1% | 11.6% | 5.7% | 3.6% | 55.0% |
| 2 | Wyoming | 46.3% | 33.8% | 12.0% | 5.2% | 2.8% | 53.8% |
| 3 | Vermont | 49.6% | 33.8% | 8.8% | 6.0% | 1.9% | 50.5% |
| 4 | Utah | 50.6% | 35.4% | 8.8% | 3.6% | 1.7% | 49.5% |
| 5 | North Dakota | 50.9% | 34.0% | 8.7% | 4.1% | 2.3% | 49.1% |
| 6 | Maine | 51.0% | 32.3% | 8.7% | 5.7% | 2.3% | 49.0% |
| 7 | Wisconsin | 51.0% | 32.0% | 9.2% | 4.8% | 2.9% | 48.9% |
| 8 | Colorado | 51.3% | 32.2% | 9.8% | 4.4% | 2.3% | 48.7% |
| 9 | Idaho | 51.6% | 34.5% | 8.3% | 2.7% | 2.9% | 48.4% |
| 10 | South Dakota | 52.1% | 32.5% | 7.6% | 5.5% | 2.3% | 47.9% |
| 11 | Minnesota | 53.1% | 31.8% | 9.0% | 4.2% | 2.0% | 47.0% |
| 12 | New Hampshire | 53.0% | 32.4% | 8.5% | 4.2% | 1.9% | 47.0% |
| 13 | Iowa | 53.0% | 31.6% | 9.8% | 3.8% | 1.8% | 47.0% |
| 14 | Kansas | 53.3% | 32.4% | 8.6% | 3.3% | 2.3% | 46.6% |
| 15 | Washington | 55.2% | 29.1% | 9.2% | 5.2% | 1.3% | 44.8% |
| 16 | West Virginia | 55.3% | 28.9% | 6.7% | 4.8% | 4.3% | 44.7% |
| 17 | Missouri | 55.5% | 31.8% | 7.2% | 3.0% | 2.4% | 44.4% |
| 18 | Oregon | 56.2% | 28.4% | 9.1% | 4.6% | 1.8% | 43.9% |
| 19 | Oklahoma | 56.7% | 31.2% | 6.7% | 3.5% | 2.0% | 43.4% |
| 20 | Arizona | 56.8% | 31.4% | 5.7% | 4.3% | 1.9% | 43.3% |
| 21 | Kentucky | 57.0% | 29.0% | 7.3% | 3.5% | 3.3% | 43.1% |
| 22 | Alaska | 57.3% | 26.2% | 8.1% | 5.9% | 2.5% | 42.7% |
| 23 | Nebraska | 57.7% | 27.8% | 8.4% | 4.0% | 2.2% | 42.4% |
| 24 | New Mexico | 57.6% | 29.9% | 7.5% | 3.5% | 1.4% | 42.3% |
| 25 | Mississippi | 57.9% | 29.7% | 3.9% | 6.4% | 2.1% | 42.1% |
| 26 | Michigan | 58.1% | 28.1% | 8.3% | 2.8% | 2.7% | 41.9% |
| 27 | Arkansas | 59.4% | 27.3% | 6.6% | 4.4% | 2.3% | 40.6% |
| 28 | Indiana | 59.4% | 28.7% | 7.1% | 3.3% | 1.4% | 40.5% |
| 29 | Connecticut | 59.9% | 28.3% | 6.1% | 3.1% | 2.6% | 40.1% |
| 30 | North Carolina | 60.1% | 27.9% | 6.3% | 4.1% | 1.7% | 40.0% |
| 31 | Tennessee | 60.0% | 29.2% | 5.8% | 3.5% | 1.5% | 40.0% |
| 32 | Georgia | 60.3% | 29.9% | 5.4% | 2.9% | 1.5% | 39.7% |
| 33 | Virginia | 60.4% | 26.9% | 6.3% | 4.7% | 1.7% | 39.6% |
| 34 | Alabama | 60.9% | 26.9% | 5.0% | 4.1% | 3.1% | 39.1% |
| 35 | Louisiana | 61.0% | 26.1% | 6.8% | 3.7% | 2.2% | 38.8% |
| 36 | Pennsylvania | 61.2% | 28.4% | 5.9% | 3.1% | 1.4% | 38.8% |
| 37 | South Carolina | 61.6% | 25.9% | 6.2% | 3.4% | 2.8% | 38.3% |
| 38 | Illinois | 61.8% | 27.1% | 6.5% | 3.3% | 1.4% | 38.3% |
| 39 | Florida | 62.2% | 27.9% | 4.8% | 3.6% | 1.6% | 37.9% |
| 40 | Delaware | 62.4% | 26.6% | 6.3% | 3.2% | 1.5% | 37.6% |
| 41 | Ohio | 62.5% | 26.7% | 6.2% | 3.1% | 1.5% | 37.5% |
| 42 | Rhode Island | 62.6% | 27.1% | 5.8% | 2.7% | 1.8% | 37.4% |
| 43 | Nevada | 63.5% | 26.5% | 5.8% | 2.5% | 1.7% | 36.5% |
| 44 | Hawaii | 64.5% | 26.8% | 5.2% | 2.6% | 0.9% | 35.5% |
| 45 | Massachusetts | 64.6% | 25.9% | 5.8% | 2.3% | 1.4% | 35.4% |
| 46 | New York | 66.0% | 23.7% | 5.2% | 3.2% | 1.8% | 33.9% |
| 47 | Maryland | 66.3% | 24.2% | 6.5% | 2.1% | 0.9% | 33.7% |
| 48 | Texas | 66.4% | 25.5% | 4.4% | 3.0% | 0.8% | 33.7% |
| 49 | New Jersey | 66.4% | 23.4% | 4.7% | 3.4% | 2.1% | 33.6% |
| 50 | California | 70.4% | 21.9% | 4.3% | 2.4% | 1.1% | 29.7% |
The 5 States Where the Most Children Were Bullied 1–2 Times in the Past 12 Months
| Rank | State | Percentage of Children Bullied 1–2 Times in the Past 12 Months |
| 1 | Utah | 35.4% |
| 2 | Idaho | 34.5% |
| 3 | Montana | 34.1% |
| 4 | North Dakota | 34.0% |
| 5 | Wyoming | 33.8% |
The 5 States Where the Most Children Are Bullied 1–2 Times per Month
| Rank | State | Percentage of Children Bullied 1–2 Times per Month |
| 1 | Wyoming | 12.0% |
| 2 | Montana | 11.6% |
| 3 | Colorado | 9.8% |
| 3 | Iowa | 9.8% |
| 5 | Wisconsin | 9.2% |
The 5 States Where the Most Children Are Bullied 1–2 Times per Week
| Rank | State | Percentage of Children Bullied 1–2 Times per Week |
| 1 | Mississippi | 6.4% |
| 2 | Vermont | 6.0% |
| 3 | Alaska | 5.9% |
| 4 | Montana | 5.7% |
| 4 | Maine | 5.7% |
The 5 States Where the Most Children Are Bullied Almost Every Day
| Rank | State | Percentage of Children Bullied Almost Every Day |
| 1 | West Virginia | 4.3% |
| 2 | Montana | 3.6% |
| 3 | Kentucky | 3.3% |
| 4 | Alabama | 3.1% |
| 5 | Wisconsin | 2.9% |
The States Where Children Are Most Likely to Bully Others
Based on the percentage of children ages 6–17 years who bullied, picked on, or excluded others in the past 12 months.
| Rank | State | Percentage of Children Who Never Bullied Others in the Past 12 Months | Percentage of Children Who Bullied Others 1–2 Times in the Past 12 Months | Percentage of Children Who Bullied Others 1–2 Times per Month | Percentage of Children Who Bullied Others 1–2 Times per Week | Percentage of Children Who Bullied Others Almost Every Day | Percentage of Children Who Bullied Others at Least Once in the Past Year |
| 1 | Montana | 74.4% | 21.2% | 2.2% | 1.4% | 0.7% | 25.7% |
| 2 | Wyoming | 76.0% | 18.6% | 3.1% | 1.7% | 0.6% | 24.2% |
| 3 | South Dakota | 76.0% | 19.1% | 3.8% | 0.7% | 0.4% | 24.2% |
| 4 | Maine | 77.1% | 17.0% | 3.1% | 2.3% | 0.4% | 23.0% |
| 5 | Iowa | 78.3% | 18.4% | 2.4% | 0.5% | 0.3% | 21.8% |
| 6 | Colorado | 78.5% | 17.3% | 2.3% | 0.8% | 1.1% | 21.7% |
| 7 | North Dakota | 78.5% | 18.0% | 2.5% | 0.8% | 0.1% | 21.6% |
| 8 | Vermont | 79.9% | 14.7% | 3.3% | 2.1% | 0.1% | 20.4% |
| 9 | Utah | 79.7% | 18.1% | 1.6% | 0.5% | 0.0% | 20.4% |
| 10 | Missouri | 79.8% | 16.1% | 2.2% | 1.6% | 0.2% | 20.3% |
| 11 | New Hampshire | 80.0% | 15.8% | 2.6% | 0.9% | 0.7% | 20.2% |
| 12 | Oklahoma | 80.5% | 13.8% | 2.6% | 2.0% | 1.1% | 19.7% |
| 13 | Wisconsin | 80.7% | 15.0% | 2.1% | 1.3% | 0.9% | 19.5% |
| 14 | Kansas | 81.4% | 14.7% | 2.5% | 1.0% | 0.4% | 18.8% |
| 15 | Minnesota | 81.9% | 13.9% | 2.7% | 1.2% | 0.3% | 18.3% |
| 16 | Nebraska | 81.9% | 14.7% | 2.2% | 0.9% | 0.3% | 18.3% |
| 17 | Indiana | 82.1% | 13.3% | 2.5% | 1.1% | 1.0% | 18.1% |
| 18 | Alaska | 82.3% | 14.4% | 1.8% | 0.9% | 0.6% | 17.9% |
| 19 | Oregon | 82.5% | 11.6% | 3.6% | 1.5% | 0.8% | 17.7% |
| 20 | Michigan | 82.6% | 13.9% | 1.9% | 1.1% | 0.3% | 17.4% |
| 21 | Idaho | 82.8% | 13.8% | 2.4% | 0.9% | 0.1% | 17.4% |
| 22 | Arizona | 83.2% | 13.5% | 1.9% | 0.9% | 0.5% | 17.0% |
| 23 | Arkansas | 83.2% | 13.4% | 2.5% | 0.6% | 0.3% | 17.0% |
| 24 | West Virginia | 83.2% | 12.9% | 2.2% | 0.9% | 0.7% | 16.9% |
| 25 | Nevada | 83.7% | 12.5% | 1.7% | 1.4% | 0.7% | 16.5% |
| 26 | Kentucky | 83.9% | 12.1% | 2.3% | 0.6% | 1.1% | 16.3% |
| 27 | Washington | 83.8% | 11.9% | 2.7% | 1.4% | 0.1% | 16.3% |
| 28 | Ohio | 84.3% | 12.4% | 1.9% | 1.1% | 0.3% | 15.9% |
| 29 | New Mexico | 84.8% | 12.4% | 1.4% | 1.2% | 0.2% | 15.4% |
| 30 | Delaware | 84.8% | 10.4% | 3.6% | 1.0% | 0.2% | 15.4% |
| 31 | Pennsylvania | 85.1% | 11.3% | 2.1% | 1.2% | 0.3% | 15.0% |
| 32 | Hawaii | 85.1% | 12.4% | 1.2% | 0.4% | 0.8% | 14.9% |
| 33 | Georgia | 85.2% | 11.7% | 2.0% | 0.5% | 0.6% | 14.9% |
| 34 | Mississippi | 85.2% | 12.5% | 0.9% | 1.0% | 0.4% | 14.9% |
| 35 | North Carolina | 85.4% | 11.5% | 2.1% | 0.8% | 0.3% | 14.8% |
| 36 | Tennessee | 85.3% | 11.8% | 1.7% | 1.1% | 0.1% | 14.8% |
| 37 | Illinois | 85.9% | 12.3% | 1.3% | 0.4% | 0.1% | 14.2% |
| 38 | South Carolina | 86.2% | 11.9% | 1.1% | 0.4% | 0.4% | 13.9% |
| 39 | Virginia | 86.6% | 9.8% | 2.1% | 0.8% | 0.7% | 13.5% |
| 40 | Alabama | 86.9% | 9.8% | 1.4% | 0.9% | 0.9% | 13.1% |
| 41 | Rhode Island | 87.2% | 10.8% | 0.8% | 0.7% | 0.5% | 12.9% |
| 42 | Connecticut | 87.3% | 10.5% | 1.5% | 0.6% | 0.1% | 12.8% |
| 43 | Florida | 87.5% | 10.6% | 0.7% | 0.5% | 0.7% | 12.6% |
| 44 | Louisiana | 87.8% | 8.6% | 2.3% | 0.8% | 0.5% | 12.3% |
| 45 | Massachusetts | 88.0% | 9.7% | 1.4% | 0.4% | 0.4% | 12.0% |
| 46 | Maryland | 88.7% | 9.0% | 1.6% | 0.7% | 0.0% | 11.4% |
| 47 | Texas | 88.8% | 9.8% | 0.7% | 0.6% | 0.1% | 11.3% |
| 48 | New York | 89.3% | 8.1% | 1.3% | 1.0% | 0.3% | 10.8% |
| 49 | New Jersey | 90.1% | 8.0% | 1.5% | 0.1% | 0.3% | 10.0% |
| 50 | California | 90.5% | 7.9% | 0.9% | 0.5% | 0.2% | 9.6% |
In the event of a tie in the percentage of children who were bullied or who bullied others at least once in the past year, the state with the higher daily percentage took precedence in the overall ranking. If that percentage was also tied, the higher weekly percentage served as the tiebreaker.
The 5 States Where the Most Children Bullied Others 1–2 Times in the Past 12 Months
| Rank | State | Percentage of Children Who Bullied Others 1–2 Times in the Past 12 Months |
| 1 | Montana | 21.2% |
| 2 | South Dakota | 19.1% |
| 3 | Wyoming | 18.6% |
| 4 | Iowa | 18.4% |
| 5 | Utah | 18.1% |
The 5 States Where the Most Children Bullied Others 1–2 Times per Month
| Rank | State | Percentage of Children Who Bullied Others 1–2 Times per Month |
| 1 | South Dakota | 3.8% |
| 2 | Oregon | 3.6% |
| 2 | Delaware | 3.6% |
| 4 | Vermont | 3.3% |
| 5 | Wyoming | 3.1% |
The 5 States Where the Most Children Bullied Others 1–2 Times per Week
| Rank | State | Percentage of Children Who Bullied Others 1–2 Times per Week |
| 1 | Maine | 2.3% |
| 2 | Vermont | 2.1% |
| 3 | Oklahoma | 2.0% |
| 4 | Wyoming | 1.7% |
| 5 | Missouri | 1.6% |
The 5 States Where the Most Children Bullied Others Almost Every Day
| Rank | State | Percentage of Children Who Bullied Others Almost Every Day |
| 1 | Oklahoma | 1.1% |
| 1 | Colorado | 1.1% |
| 1 | Kentucky | 1.1% |
| 4 | Indiana | 1.0% |
| 5 | Wisconsin | 0.9% |
Sources
2022–2023 National Survey of Children’s Health
https://www.childhealthdata.org/browse/survey/allstates?q=11064
https://www.childhealthdata.org/browse/survey/allstates?q=11063