Meet Your ACT 31 Pennsylvania Continuing Education Requirement Quickly & Affordably.

Creating a safe, healthy, and happy home for children is a goal shared by millions of Americans. Unfortunately, extenuating circumstances often contribute to less-than-ideal living situations. The team at PARequirements.com has analyzed data from the National Survey of Children’s Health to determine which states are the most unsafe for children based on their neighborhood conditions.
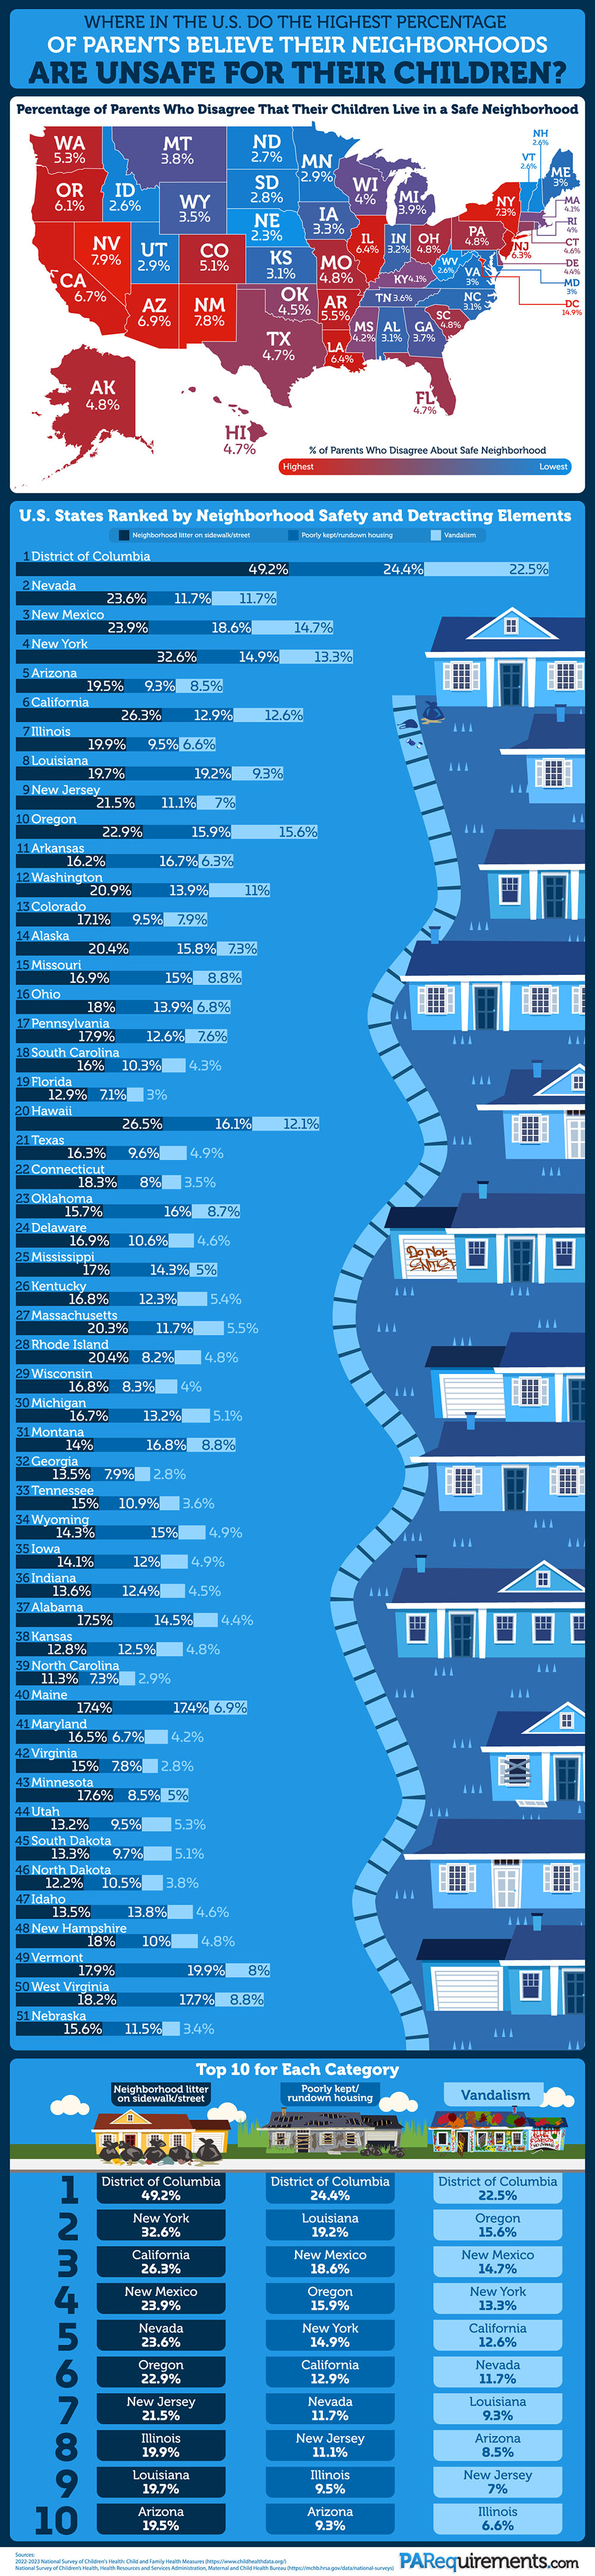
It is important to highlight these unsafe neighborhoods in the United States because a child’s health, happiness, and success often begin at home. While many children can thrive in various environments, living in a safe neighborhood can significantly boost their mental, physical, and social well-being. By showcasing which states have the most rundown housing, vandalism, and litter, we can pinpoint patterns and spur targeted efforts. Here are the results:
Click here to download the printable PDF version of the chart.
Why Is Washington, D.C. So Dangerous?
While Washington, D.C.’s high ranking is influenced in part by its status as a federal district being compared to entire states, it is undeniable that crime rates in Washington, D.C. are higher than in many other U.S. cities and regions. In 2023, Washington, D.C. suffered a sharp spike in violence; homicides reached a peak not seen since the late 1990s, and carjackings nearly doubled since the previous year. Despite this alarming setback, Washington D.C.’s crime rates have declined in 2024 and 2025, as they have overall since the 1960s. Despite the data, it is understandable why our findings reflect a distrust of neighborhood safety by parents in the capital.
According to Cornell University, a great deal of violent crimes in Washington, D.C. are committed by juveniles and teenagers. Why are teenagers in D.C. committing more crimes? The issue is multifaceted, but two major factors include less significant legal consequences for those underage and overall negligence by caretakers and guardians. Without proper guidance and support, countless teens fall through the cracks and become caught in a cycle of crime and violence, a situation worsened by easy access to deadly weapons in D.C. and other cities.
Stress is another compounding factor. The Youth Risk Behavior Survey, conducted by the U.S. Centers for Disease Control and Prevention, found that 40% of high school teenagers reported persistent feelings of hopelessness and sadness in 2023. While this figure has dropped slightly from the 42% peak during the COVID-19 pandemic, it is still around 10 percentage points higher than in the previous decade.
Although violent crimes committed by youths have experienced an uptick in recent years, it is important to note that the rate has declined dramatically since its peak in the 1990s. There is hope on the horizon, but we must strive to be more mindful of the mental health struggles young people are facing today.
Why Does Washington, D.C. Have So Much Litter?
Reports show that 49.2% of parents have seen litter on the sidewalks and streets of their neighborhood. Many D.C. neighborhoods, especially lower-income areas like Ward 8 Woods, constantly face trash issues. Failure in waste management results in overflowing trash cans and dumpsters, leading to a buildup of garbage in parks, waterways, and vacant lots. This contamination affects soil, water, and air, harms wildlife, and attracts pests.
Studies show that people are more likely to litter if there is already litter present, so the issue accumulates to nearly insurmountable levels. Littering is tied to feelings of powerlessness and alienation, common experiences among those struggling to get by. Dirty, cluttered environments also negatively impact mental health, creating a vicious cycle that makes neighborhoods feel unsafe and hopeless.
Fortunately, there are initiatives dedicated to tackling the issue, such as Trash Free DC. District Cleanups organizes community cleanup events around the District of Columbia—these not only help create healthier, happier environments but also promote fun and socialization.
Which State Has the Most Unsafe Neighborhoods?
In Nevada, 7.9% of parents disagreed that their children live in a safe neighborhood, the highest among all U.S. states. Crime rates in Nevada tend to be higher than the national average across the board. In 2024, the state’s violent crime rate reached 402 incidents per 100,000 people, which is 11.9% higher than the U.S. average. Additionally, there were 2,197 property crimes per 100,000 people in Nevada that same year, a staggering 24.8% higher than average. These crime statistics likely contribute to the unease many parents feel about the safety of the neighborhoods where their children are growing up.
Is Nevada a good place for children overall? Unfortunately, Nevada has consistently ranked poorly on factors affecting children’s well-being and placed 47th out of 50 in the 2025 KIDS COUNT Data Book, a data-driven report from the Annie E. Casey Foundation that gauges how children are faring in America. Nevada ranked 48th in economic well-being, 46th in education, 45th in health, and 45th in family and community.
The struggles of families are often reflected in neighborhood conditions, crime patterns, and the overall sense of community. Studies demonstrate that when children grow up healthy and connected, they are more likely to thrive as adults. Good schools, stable homes, nourishing foods, meaningful connections, and playful opportunities are all key components to creating a culture of success.
While Nevada still has a long way to go, initiatives like the Children’s Advocacy Alliance are making informed strides in the right direction.
Why It Matters to PARequirements
PARequirements has been providing nurses with the knowledge and empowerment they need to protect children in accordance with the law since our parent organization was founded in 1987. We are passionate about sharing information and training courses that help parents, educators, healthcare providers, and childcare professionals take informed, effective action to create better communities for our children. The first step to change is awareness, and our goal is to contribute to that awareness in any way that we can.
In Which Areas Do the Highest Percentage of Children Live in Unsafe Neighborhoods?
| State/Region | Percentage of Parents Who Disagree About Safe Neighborhood | Neighborhood Litter on Sidewalk/Street | Poorly Kept/Rundown Housing | Vandalism |
| District of Columbia | 14.9% | 49.2% | 24.4% | 22.5% |
| Nevada | 7.9% | 23.6% | 11.7% | 11.7% |
| New Mexico | 7.8% | 23.9% | 18.6% | 14.7% |
| New York | 7.3% | 32.6% | 14.9% | 13.3% |
| Arizona | 6.9% | 19.5% | 9.3% | 8.5% |
| California | 6.7% | 26.3% | 12.9% | 12.6% |
| Illinois | 6.4% | 19.9% | 9.5% | 6.6% |
| Louisiana | 6.4% | 19.7% | 19.2% | 9.3% |
| New Jersey | 6.3% | 21.5% | 11.1% | 7.0% |
| Oregon | 6.1% | 22.9% | 15.9% | 15.6% |
| Arkansas | 5.5% | 16.2% | 16.7% | 6.3% |
| Washington | 5.3% | 20.9% | 13.9% | 11.0% |
| Colorado | 5.1% | 20.4% | 15.8% | 7.3% |
| Alaska | 4.8% | 20.4% | 15.8% | 7.3% |
| Missouri | 4.8% | 16.9% | 15.0% | 8.8% |
| Ohio | 4.8% | 18.0% | 13.9% | 6.8% |
| Pennsylvania | 4.8% | 17.9% | 12.6% | 7.6% |
| South Carolina | 4.8% | 16.0% | 10.3% | 4.3% |
| Florida | 4.7% | 12.9% | 7.1% | 3.0% |
| Hawaii | 4.7% | 26.5% | 16.1% | 12.1% |
| Texas | 4.7% | 16.3% | 9.6% | 4.9% |
| Connecticut | 4.6% | 18.3% | 8.0% | 3.5% |
| Oklahoma | 4.5% | 15.7% | 16.0% | 8.7% |
| Delaware | 4.4% | 16.9% | 10.6% | 4.6% |
| Mississippi | 4.2% | 17.0% | 14.3% | 5.0% |
| Kentucky | 4.1% | 16.8% | 12.3% | 5.4% |
| Massachusetts | 4.1% | 20.3% | 11.7% | 5.5% |
| Rhode Island | 4.0% | 20.4% | 8.2% | 4.8% |
| Wisconsin | 4.0% | 16.8% | 8.3% | 4.0% |
| Michigan | 3.9% | 16.7% | 13.2% | 5.1% |
| Montana | 3.8% | 14.0% | 16.8% | 8.8% |
| Georgia | 3.7% | 13.5% | 7.9% | 2.8% |
| Tennessee | 3.6% | 15.0% | 10.9% | 3.6% |
| Wyoming | 3.5% | 14.3% | 15.0% | 4.9% |
| Iowa | 3.3% | 14.1% | 12.0% | 4.9% |
| Indiana | 3.2% | 13.6% | 12.4% | 4.5% |
| Alabama | 3.1% | 17.5% | 14.5% | 4.4% |
| Kansas | 3.1% | 12.8% | 12.5% | 4.8% |
| North Carolina | 3.1% | 11.3% | 7.3% | 2.9% |
| Maine | 3.0% | 17.4% | 17.4% | 6.9% |
| Maryland | 3.0% | 16.5% | 6.7% | 4.2% |
| Virginia | 3.0% | 15.0% | 7.8% | 2.8% |
| Minnesota | 2.9% | 17.6% | 8.5% | 5.0% |
| Utah | 2.9% | 13.2% | 9.5% | 5.3% |
| South Dakota | 2.8% | 13.3% | 9.7% | 5.1% |
| North Dakota | 2.7% | 12.2% | 10.5% | 3.8% |
| Idaho | 2.6% | 13.5% | 13.8% | 4.6% |
| New Hampshire | 2.6% | 18.0% | 10.0% | 4.8% |
| Vermont | 2.6% | 17.9% | 19.9% | 8.0% |
| West Virginia | 2.6% | 18.2% | 17.7% | 8.8% |
| Nebraska | 2.3% | 15.6% | 11.5% | 3.4% |
Sources:
2022–2023 National Survey of Children's Health: Child and Family Health Measures (https://www.childhealthdata.org/)
National Survey of Children’s Health, Health Resources and Services Administration, Maternal and Child Health Bureau (https://mchb.hrsa.gov/data/national-surveys)